Using Relationships and Joins Between Tables
ANSCI 4940 - Spring 2026
Learning objectives
By the end of this lecture, students will be able to:
- Explain what tables, keys, and relationships are using dairy data
- Distinguish between different types of joins
- Decide which join to use for cow and milk production data
- Implement joins and relationships in Excel and Tableau
- Diagnose common join-related data problems in animal records
Why this matters in dairy data
Dairy data is rarely stored in one table:
- Cow information
- Daily milk production records
- Health or reproduction events
To answer questions, we must combine tables correctly.
From flat files to relational thinking
- One big spreadsheet with everything seems easy… at first
- Repeating cow information every day causes:
- Errors
- Inconsistencies
- Very large files
Relational data solves this by splitting data into tables.
What is a table?
A table is:
- Rows = observations (records)
- Columns = variables (fields)
In our example:
CowsMilkProduction
Each table describes one thing.
The idea of a key
A key is a column that identifies rows.
- Primary key: uniquely identifies a row
CowID
- Foreign key: refers to a key in another table
CowIDinsideMilkProduction
Example: Cow data
Cows
| CowID | Breed | YearOfBirth |
|---|---|---|
| 101 | Holstein | 2019 |
| 102 | Holstein | 2020 |
| 103 | Jersey | 2018 |
Example: Daily milk production
MilkProduction
| CowID | Date | MilkYield (kg/cow) |
|---|---|---|
| 101 | 2025-01-01 | 32.5 |
| 101 | 2025-01-02 | 33.1 |
| 102 | 2025-01-01 | 28.4 |
| 104 | 2025-01-01 | 30.0 |
Relationships vs joins (important!)
Two ways to combine cow and production tables:
- Relationships (logical connection)
- Joins (physical merge)
Tableau makes this distinction explicit. Excel mostly works with joins.
Relationships (conceptual)
A relationship says:
“These tables are related by CowID.”
- Tables stay separate
- Combination happens when needed
- Less risk of duplicating cow information
Joins (physical)
A join:
- Combines rows into a new table
- Based on matching CowID values
- Choice of join affects which records remain
This is where many data mistakes occur.
Visual intuition for joins
Think in terms of sets of cows:
- Cows table
- Milk production table
- Overlap based on CowID
We now look at the four main joins.
Type of joins
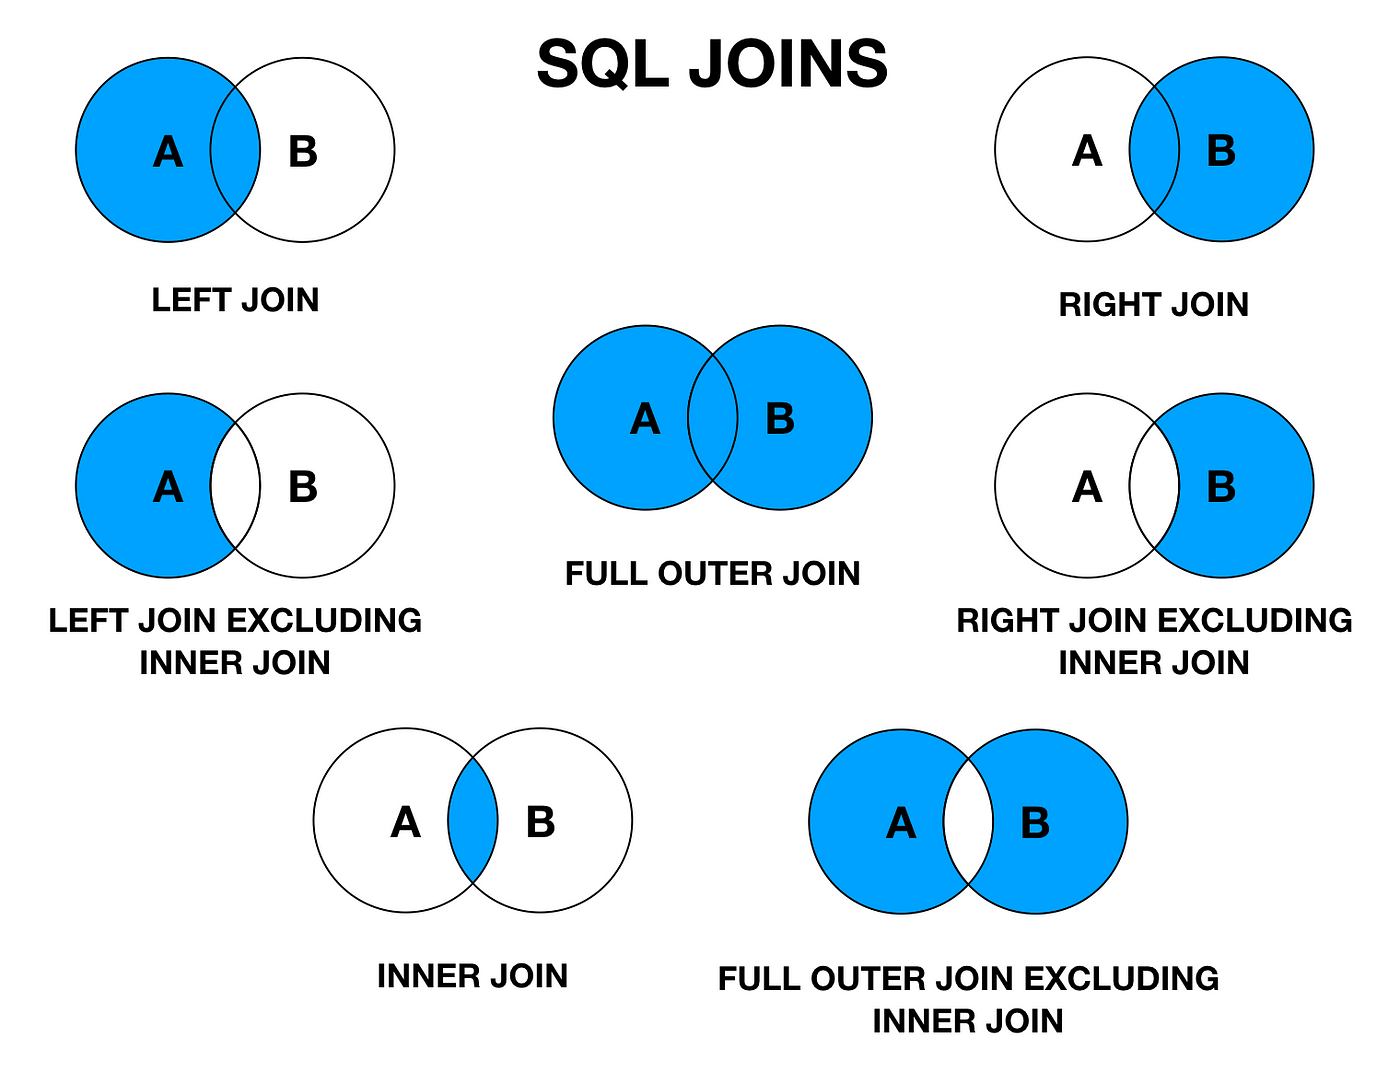
Inner join
Keeps only matching cows
- CowID must exist in both tables
- Drops production records without cow info
Use when: - You only want valid cows with production data
Inner join example
Cows ⨝ MilkProduction
- Cow 101 → kept
- Cow 102 → kept
- Cow 103 → dropped (no production)
- Cow 104 → dropped (no cow record)
Result: only cows with valid production records.
Left join
Keeps all cows
- Production data added when available
- Missing production becomes
NULL
Use when: - The cow list is your main population
Left join example
Cows ← MilkProduction
- All cows kept (101–103)
- Cow 103 → Milk_kg = NULL
Very common for herd summaries.
Right join
Keeps all production records
- Even if CowID is missing in cow table
Rarely ideal, but useful for: - Detecting data quality issues
Full outer join
Keeps all cows and all production records
- Highlights mismatches clearly
- Unmatched rows filled with NULLs
Use when: - Auditing or cleaning data
Common join pitfalls in dairy data
- Duplicate CowID values
- Missing cows or production days
- Text vs numeric CowID
- Reused IDs across farms
Always check row counts after joining.
Practical part 1: Excel
Goal:
- Combine cow and milk tables using CowID
- Understand what Excel is doing
Excel tools for joins
Main options:
- XLOOKUP (simple lookups)
- Power Query (proper joins)
We focus on Power Query.
Excel: Power Query workflow
- Load
CowsandMilkProduction - Open Power Query Editor
- Merge queries on CowID
- Choose join type
- Expand milk variables
Excel demo (in class)
Instructor demonstration:
- Left join cows with milk records
- Inspect NULL milk values
- Discuss interpretation
Practical part 2: Tableau
Same data, different philosophy.
Tableau encourages relationships first.
Tableau: creating a relationship
Steps:
- Connect
Cows - Add
MilkProduction - Relate on CowID
- Leave tables separate
No join type selected.
Why Tableau relationships work well here
- One-to-many (cow → many days)
- Correct aggregation of milk yield
- Avoids duplicated cow attributes
Comparing Excel and Tableau
| Concept | Excel | Tableau |
|---|---|---|
| Key | CowID | CowID |
| Relationships | Limited | Native |
| Joins | Power Query | Physical layer |
| Validation | Manual | Visual |
Recap
Today we learned:
- CowID links cow and milk tables
- Joins determine which records survive
- Same logic applies across tools
- Wrong joins = wrong conclusions
Final message
Good dairy analysis starts with correct data structure.